
Summary
- The model prices every NBL game to a full probability distribution, and those probabilities are well calibrated. On a market this efficient, being calibrated is not itself an edge, and we don't claim it is.
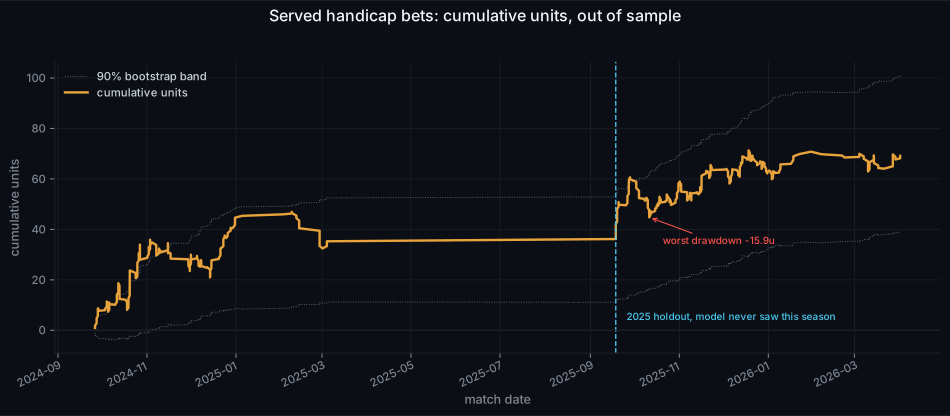
- One pocket of betting edge clears our bar: the handicap bets our system serves. On the pooled 2024–2025 sample that is about +16% per dollar staked, with a bootstrap 95% interval of [+6%, +20%] that excludes zero, and it clears the same bar on the 2025 season on its own, which the model never saw during development.
- There is no demonstrated edge on the head-to-head market or on the bets the system declines to serve.
- Every number here is from the systematically backtested model, which prices each game off default line-ups and public information only. It is the weakest-informed version of what we run. Live, we feed it player-outs, replacements and team news by hand before it prices a bet: information the backtest never sees. Read these results as a lower bound.
Notes
If you want to know more about our processes, email [email protected].


Where the model has an edge
The one result that clears our bar, the ones that don't, and what kind of edge it is.

How the model is built
The predictive distribution, the information it runs on, and how a signal earns its place.

How the model is tested
The data split, walk-forward scoring, the leak audits, and the bar a result has to clear.
The numbers
A decade of out-of-sample accuracy, the 2025 holdout, the equity curves, and the caveats.

Closing-line value
Why we can post strong CLV on demand, why we don't, and why it's a poor gauge of our signal.