Closing-line value
Closing-line value is the number people ask for first. Here is why it is not the number we optimise, and what happens when you try.
What CLV measures
Closing-line value asks one question: by the time the game started, had the market moved toward your bet or away from it? The closing line is the sharpest public price a game ever has, so beating it consistently is usually read as being ahead of the market.
The catch is what "ahead of the market" means here. CLV rewards a bet for landing where the market's own consensus ends up. It says nothing directly about whether the bet wins: those are two different questions, and for our signals they have different answers.
Closing-line value
For a bet struck at some entry price, compare the de-vigged fair probability of the bet side then against the same quantity at the last price before tip-off. Positive CLV means the market moved toward the bet: the standard proxy for a signal being ahead of the market.
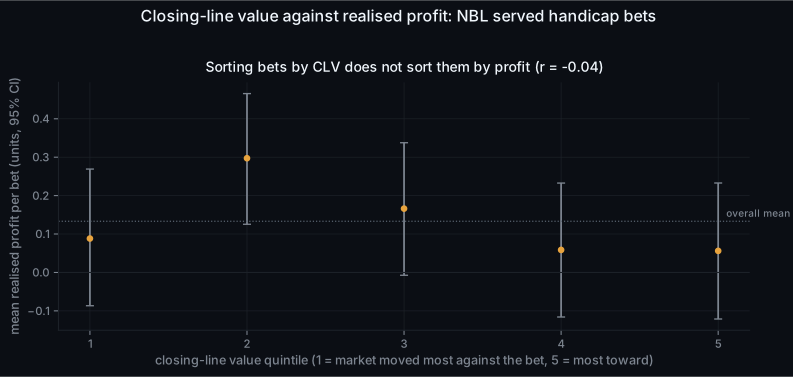
Where it can mislead. In our own earlier work on a different league, CLV did not predict realised profit bet-by-bet. On the NBL handicap bets it comes back slightly negative, which is why we report realised equity curves and the claimed-edge diagnostic rather than leaning on CLV.
We can predict it: more easily without our model
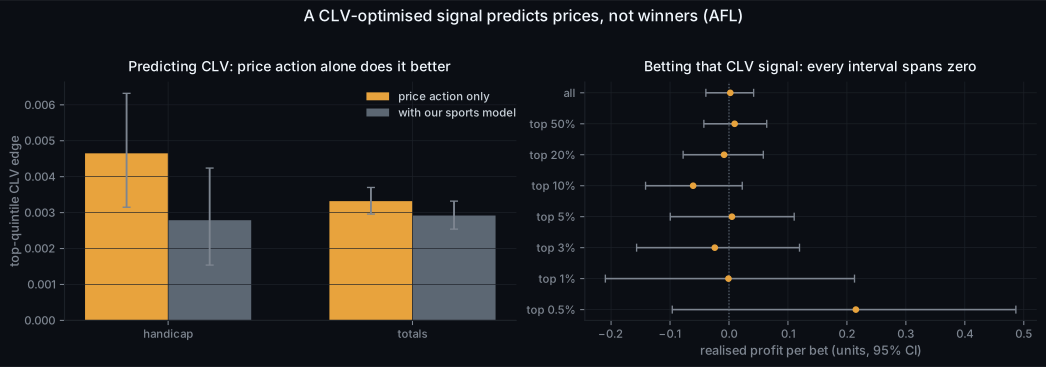
On AFL, where the bet sample is an order of magnitude larger, we built a classifier that predicts CLV from market data alone: prices, overrounds, cross-book spreads, where one book sits relative to the others, and timing. It never sees our sports model. It predicts closing-line value more reliably than our sports-model features do, in both the handicap and totals markets, with bootstrap intervals that exclude zero at every cut we tested.
That result makes sense. Predicting how a price will move is a market-microstructure problem, and market microstructure is exactly what that classifier is built from. It has almost nothing to do with predicting the game.
Bootstrap confidence intervals
To put an honest error bar on an average (profit per bet, a win rate, a CRPS gap) we resample the observations we have, with replacement, ten thousand times, recompute the average each time, and take the middle 95% of those values. We only call something demonstrated when this interval sits entirely on one side of zero. We lean on the bootstrap rather than a parametric error bar specifically because the NBL samples are small: a few hundred bets across roughly two hundred matches, so it makes no distributional assumptions the data can't support.
Where it can mislead. The bet rows are not fully independent (one match can be entered on several days), so we resample whole rows and always quote the match count next to the sample size. A significant t-statistic on a single fixed test set is not enough at our sample sizes.
It doesn't pay
Turn that CLV classifier into a staking rule (bet the legs it scores highest, walk-forward) and the realised profit interval spans zero everywhere: the whole bet population, the top 10%, the top 1%, the sharpest 0.5%. A signal tuned to agree with the market's eventual price agrees with the market's eventual price. It does not have an edge over that price, because it was built from it.
This is the general point. A feature that reliably forecasts a price move is not thereby a feature that forecasts a result, and optimising for the first can cost you the second.
Expected value and claimed edge
At our probability p for an outcome priced at decimal odds o, a one-unit bet pays o − 1 with probability p and loses 1 otherwise. We bet the side of a market with the larger expected value, and call that number the claimed edge.
Where it can mislead. Claimed edge is our estimate of value, not a realised result. In this project it turned out not to rank which bets actually win: the entry-timing section covers this.
Why our own CLV looks ordinary
Our edge is deliberately part-orthogonal to how the market forms its price. Some of what the model knows, the market prices in too, and there the closing line moves toward us. Some of it the market does not price, and there the line never converges to our number, so that part of the edge shows up as realised profit and contributes nothing to CLV.
The result is that our CLV sits near neutral while our realised P&L does not, and sorting our NBL bets by CLV does not sort them by profit: the correlation is close to zero. We could bolt the market-tracking features onto our signal and lift its CLV. It would make the signal look more like the market, and make it less profitable.
What we grade on instead
Realised out-of-sample profit with bootstrap intervals, and entry timing. Both are on the numbers page. We record and publish CLV because it is the number people ask for and because a sharp negative CLV would be a genuine warning, but for a signal built to sit partly outside the market's price, it is not the measure of quality it is often taken to be.