The numbers
The out-of-sample numbers, with their intervals. Walk-forward accuracy over a decade, the 2025 holdout, the entry-timing diagnostic, and the equity curves. Handicap stakes are sized by the model's conviction. Pushes excluded; every interval is a ten-thousand-sample bootstrap.
Walk-forward accuracy
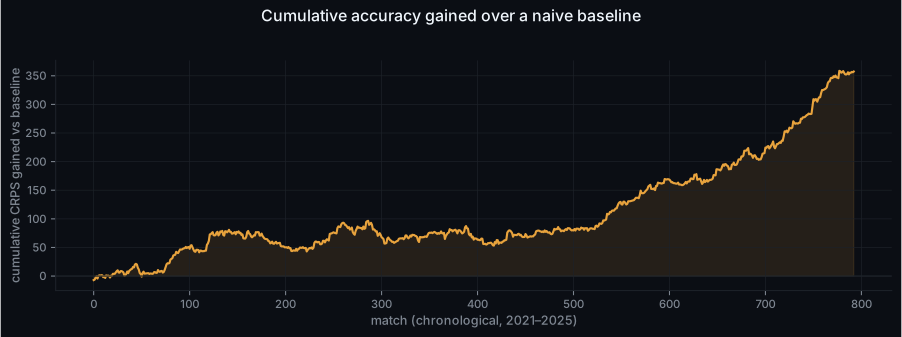
Against a naive baseline (predict the historical mean margin, with the historical spread) forecasting skill accumulates steadily, every season, including the two the model never saw. Per-season accuracy and interval coverage stay in a tight band.
2025 is the loosest season, at about 0.81 interval coverage against a 0.90 target: mildly over-confident. Nothing about 2025 was used to tune anything; this is what the model did on a clean season.
Predicted vs actual
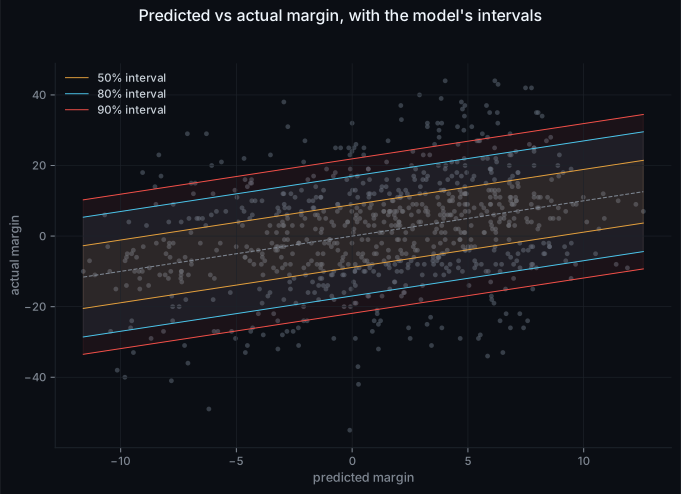
Plotting every predicted margin against what actually happened, with the model's own 50, 80 and 90% intervals drawn on: roughly the right share of results fall inside each band, across the whole range of predicted margins.
2024 and 2025
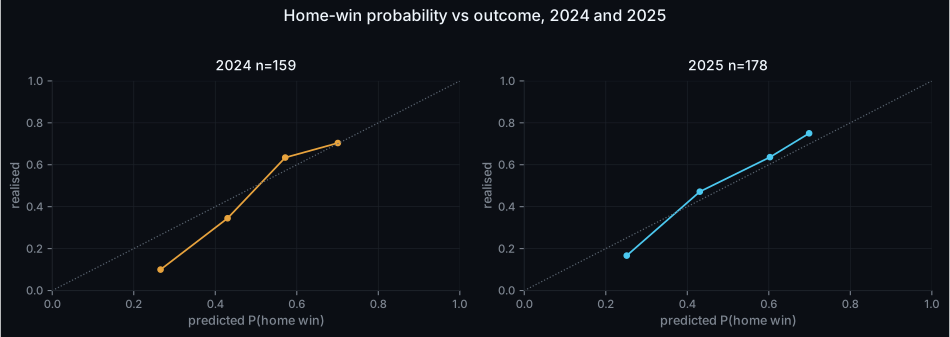
On the 2025 holdout the model's win probabilities sit close to the diagonal. The margin forecast for 2025 is slightly wide: the one blemish, and we report it as one. Nothing about the season was used to tune the model.
| Season | Matches | Margin bias | Margin CRPS | 90% interval cover |
|---|---|---|---|---|
| 2024 | 159 | +0.43 | 8.19 | 0.84 |
| 2025 | 178 | -0.43 | 9.14 | 0.81 |
Entry timing
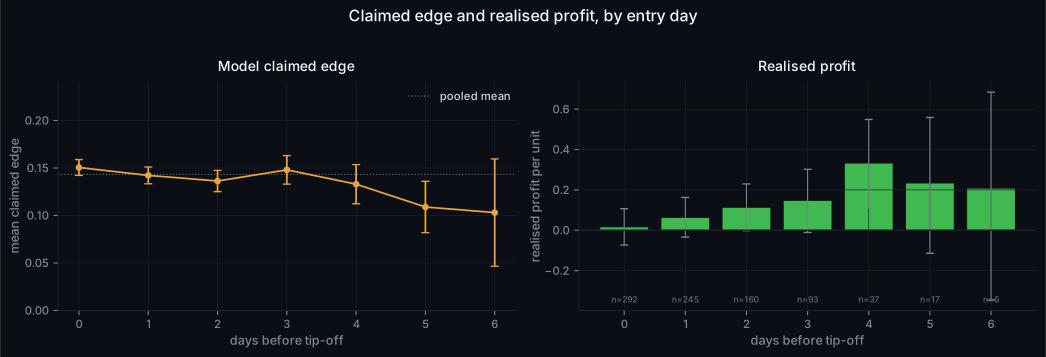
The model's claimed edge is flat across lead times and roughly equal for bets that eventually won and bets that eventually lost. What moves realised profit is when the bet is entered: it climbs steadily as entry moves from tip-off back to three or four days out. Earlier, the market's price reflects less of the idiosyncratic player and team news that sits outside the backtested model's scope, therefore an early bet is much less exposed to being adversely selected on information the model has not seen. The served strategy is defined by an entry window for that reason, and the backtested profit is a lower bound: live, the model is given the same team news the market has before it prices the bet.
Equity curves
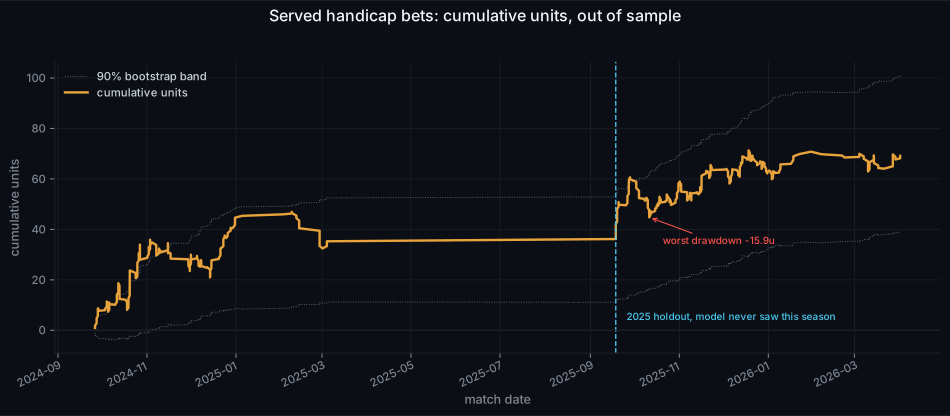
Every curve is plotted against the real calendar, each bet at its actual date, not against a bet counter. A bet-number axis silently compresses the off-season and the sparse weeks; against time, the flat stretches are calendar time with no served bet in it.
The served handicap curve is sized by the model's conviction: every served bet is still placed, but the stake ramps from a quarter-unit to a full unit as claimed edge rises. This was added because the worst drawdown under flat stakes traced to a clustered run of large prediction misses that no claimed-edge level or entry window could have isolated in advance. Excluding those bets would have meant knowing the outcome first. Sizing by conviction is decided purely from what is known before the bet resolves, and it cut the worst drawdown from about −25 units to about −15.9 with the edge intact.
Summary
A calibrated probabilistic model, checked out of sample across the 2016–2025 seasons (1459 matches) including one untouched holdout, with one pocket of betting edge that clears our bar: early-entry handicap bets, bootstrap interval excluding zero on the pooled sample and on each season on its own. Every figure on these pages is reproducible from the model's own frozen predictions and the recorded market history.
Two forces work against a static model from here: the irreducible noise in the sport, and a market we expect to price these games more efficiently over the coming seasons. We expect our own edge to widen against both: the served model already carries a live information layer the backtest cannot use, and the method behind it is still being extended.
| Bets | Matches | Profit / $ staked | Win rate | 95% interval | ||
|---|---|---|---|---|---|---|
| Handicap: all claimed-edge bets | 726 | 275 | +11.7% | 57.6% | [+3.6%, +15.9%] | excludes zero |
| Handicap: served by our system | 532 | 204 | +15.9% | 59.4% | [+6.0%, +20.0%] | excludes zero |
| Handicap: served, 2024 only | 244 | 82 | +17.6% | 59.8% | [+3.9%, +24.8%] | excludes zero |
| Handicap: served, 2025 holdout only | 288 | 122 | +14.4% | 59.0% | [+1.9%, +21.5%] | excludes zero |
| Handicap: bets the system did not serve | 194 | 82 | +1.0% | 52.6% | [-11.1%, +13.0%] | — |