Where the model has an edge
Where the model's forecasts turn into a real, measurable advantage, and where they don't.
Edge
Every price we quote is read off the model's predicted distribution for the game. "Edge" is our fair probability minus the market's own de-vigged probability, turned into expected value at the price on offer. If our probability for a side is and the odds are , a one-unit bet is worth .
Expected value and claimed edge
At our probability p for an outcome priced at decimal odds o, a one-unit bet pays o − 1 with probability p and loses 1 otherwise. We bet the side of a market with the larger expected value, and call that number the claimed edge.
Where it can mislead. Claimed edge is our estimate of value, not a realised result. In this project it turned out not to rank which bets actually win: the entry-timing section covers this.
De-vigging a two-way market
Bookmaker prices carry a margin, so the raw implied probabilities from the two sides of a market add up to more than 100%. Dividing each by that total recovers the market's implied fair probabilities. Every "market probability" on these pages is de-vigged this way, so model-versus-market comparisons are like-for-like.
Where it can mislead. Splitting the margin evenly across both sides is the simplest de-vig and the one we use; other methods exist and shift the fair line slightly, especially on lopsided prices.
From the distribution to the prices
The head-to-head price and every handicap line are read off the same margin distribution. NBL has no draw, so with a half-point continuity correction the home win probability and the cover probability at any handicap both fall out of one object, which makes the prices mutually consistent by construction.
Where it can mislead. Consistency by construction is a strength, but it also means a mis-calibrated σ shows up in every price at once.
Calibration
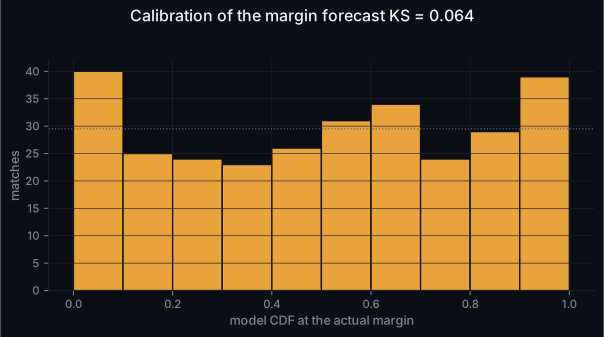
Before asking whether the model makes money, ask whether its probabilities are any good. They are well calibrated: the position of each actual result within its forecast is close to evenly spread, and roughly the right share of results land inside each interval.
Being calibrated is not the same as having an edge over an efficient market, and we don't claim one on the probabilities themselves. So if there is a real edge, it has to show up as money. That is the rest of this note.
CRPS: Continuous Ranked Probability Score
Our main accuracy score. It compares the whole predicted distribution F against the one number that actually happened, y. It is strictly proper: a model can only improve its CRPS by stating its real uncertainty, never by bluffing, and it collapses to plain mean absolute error when the forecast is a single number, so it reads on the same scale as points. Lower is better.
Where it can mislead. CRPS rewards a sharp, calibrated distribution, but it does not translate one-for-one into profit: a model that quietly predicts the same average distribution for every game can still score well while having nothing useful to say about which side to bet.
PIT and calibration
For each game we ask: where did the actual result fall in the model's predicted distribution? If the model is honest about its uncertainty, those positions should be spread evenly between 0 and 1: a flat histogram. We test the flatness with the Kolmogorov–Smirnov statistic (smaller is better) and by checking coverage: about 50 / 80 / 90% of results should land inside the model's central 50 / 80 / 90% intervals.
Where it can mislead. A U-shaped histogram means the model is over-confident (intervals too narrow); a hump in the middle means it is under-confident. Calibration says nothing about whether the model beats the market: only whether its stated uncertainty is truthful.
Served handicap bets
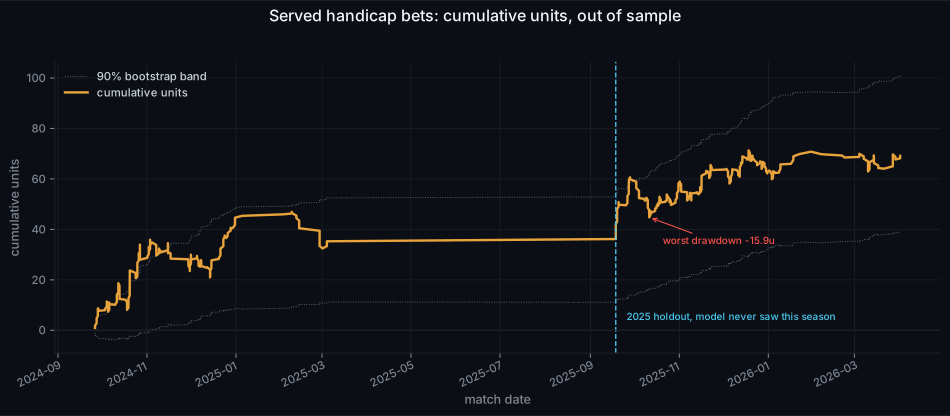
We take the handicap market, because that is where the model's distribution has the most to say. For every match and every day from tip-off back to six days out, we take the freshest quote, work out our claimed edge on each side of the line, bet the better side at the best price across books, and settle it. Whether a given bet is served is decided by our staging rules: the same procedure an operator running the tips would follow.
On the pooled 2024–2025 sample that is 532 served bet-opportunities across 204 matches, about +15.9% per dollar staked, with a bootstrap 95% interval of [+6%, +20%] on profit per bet, it excludes zero. Split by season, 2024 and the untouched 2025 holdout each clear the same bar on their own (+14.4% per dollar in 2025, interval [+2%, +22%]). Stakes are sized by the model's own conviction, from a quarter-unit to a full unit.
| Bets | Matches | Profit / $ staked | Win rate | 95% interval | ||
|---|---|---|---|---|---|---|
| Pooled 2024 + 2025 | 532 | 204 | +15.9% | 59.4% | [+6.0%, +20.0%] | excludes zero |
| 2024 (test window) | 244 | 82 | +17.6% | 59.8% | [+3.9%, +24.8%] | excludes zero |
| 2025 (untouched holdout) | 288 | 122 | +14.4% | 59.0% | [+1.9%, +21.5%] | excludes zero |
| Bets the system did not serve | 194 | 82 | +1.0% | 52.6% | [-11.1%, +13.0%] | — |
Bootstrap confidence intervals
To put an honest error bar on an average (profit per bet, a win rate, a CRPS gap) we resample the observations we have, with replacement, ten thousand times, recompute the average each time, and take the middle 95% of those values. We only call something demonstrated when this interval sits entirely on one side of zero. We lean on the bootstrap rather than a parametric error bar specifically because the NBL samples are small: a few hundred bets across roughly two hundred matches, so it makes no distributional assumptions the data can't support.
Where it can mislead. The bet rows are not fully independent (one match can be entered on several days), so we resample whole rows and always quote the match count next to the sample size. A significant t-statistic on a single fixed test set is not enough at our sample sizes.
+15.9% per dollar staked is a backtest figure on a modest sample and comes with real caveats: see the entry-timing and closing-line sections below. It is not a forecast of what a subscriber will make. We publish it because it is actual model performance, and because we expect the model to perform similarly across these metrics in future seasons, if not better, as we keep extending the depth and breadth of our work on NBL data.
Entry timing
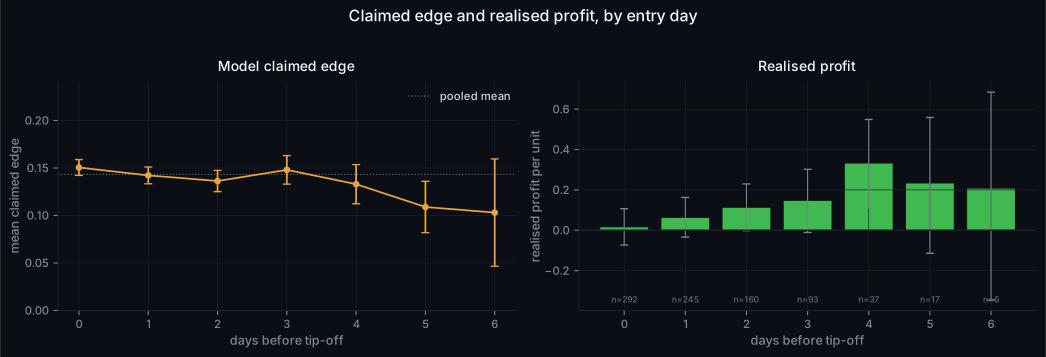
The model's edge is constant across lead times: its claimed edge sits near 13% whether a bet is entered six days out or at tip-off. What changes with the lead time is the information already in the market's price. Early, the line reflects less of the idiosyncratic player and team news that sits outside the backtested model's scope, so an early bet is far less exposed to being adversely selected on information we haven't modelled. Late, the market has absorbed that news and an uninformed bet is trading against it.
Realised profit follows exactly that: roughly −2% entering at the last minute, +12% at three days out, higher still at four. The served strategy is therefore defined by an entry window rather than an edge threshold, and this backtested result is a lower bound, because the live model is fed the same player-outs and replacements the market has, before it prices the bet.
Closing-line value
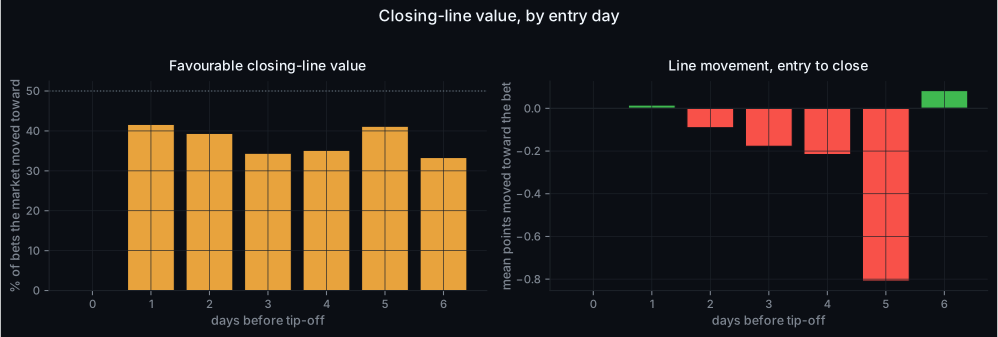
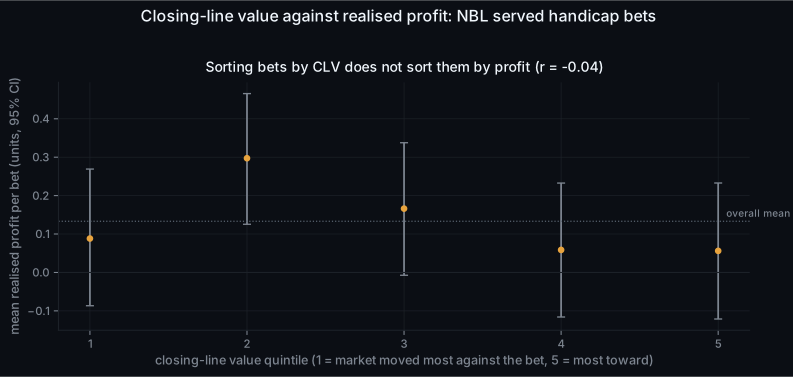
Closing-line value (whether the market moves toward a bet by tip-off) is the standard proxy for a signal being ahead of the market. For our bets it is roughly flat: about a quarter close favourably, and the line drifts slightly against the bet on average.
That is expected, not a warning sign. A meaningful part of our prediction power is orthogonal to what the market prices, so the closing line never converges to our number, and CLV carries almost no information about whether a given bet wins. We have checked this thoroughly on both AFL and NBL: sorting bets by CLV does not sort them by realised profit. We record CLV for completeness, but for our signals it is a poor measure of quality: the realised equity curve and the entry-timing result are the honest reads.
Closing-line value
For a bet struck at some entry price, compare the de-vigged fair probability of the bet side then against the same quantity at the last price before tip-off. Positive CLV means the market moved toward the bet: the standard proxy for a signal being ahead of the market.
Where it can mislead. In our own earlier work on a different league, CLV did not predict realised profit bet-by-bet. On the NBL handicap bets it comes back slightly negative, which is why we report realised equity curves and the claimed-edge diagnostic rather than leaning on CLV.
We could build a signal that tracks the market's own price formation and posts strong CLV on demand, we have, on AFL. It doesn't make money. Closing-line value, in full →
Scorecard
Stripped of the narrative, this is what clears the bar and what doesn't. The served handicap bets (pooled and in each season on its own) clear it. Everything else sits on or across zero.
| Bets | Matches | Profit / $ staked | Win rate | 95% interval | ||
|---|---|---|---|---|---|---|
| Handicap: all claimed-edge bets | 726 | 275 | +11.7% | 57.6% | [+3.6%, +15.9%] | excludes zero |
| Handicap: served by our system | 532 | 204 | +15.9% | 59.4% | [+6.0%, +20.0%] | excludes zero |
| Handicap: served, 2024 only | 244 | 82 | +17.6% | 59.8% | [+3.9%, +24.8%] | excludes zero |
| Handicap: served, 2025 holdout only | 288 | 122 | +14.4% | 59.0% | [+1.9%, +21.5%] | excludes zero |
| Handicap: bets the system did not serve | 194 | 82 | +1.0% | 52.6% | [-11.1%, +13.0%] | — |